Monsoon Risk Intelligence Platform

Predict textile stock
volatility from rainfall

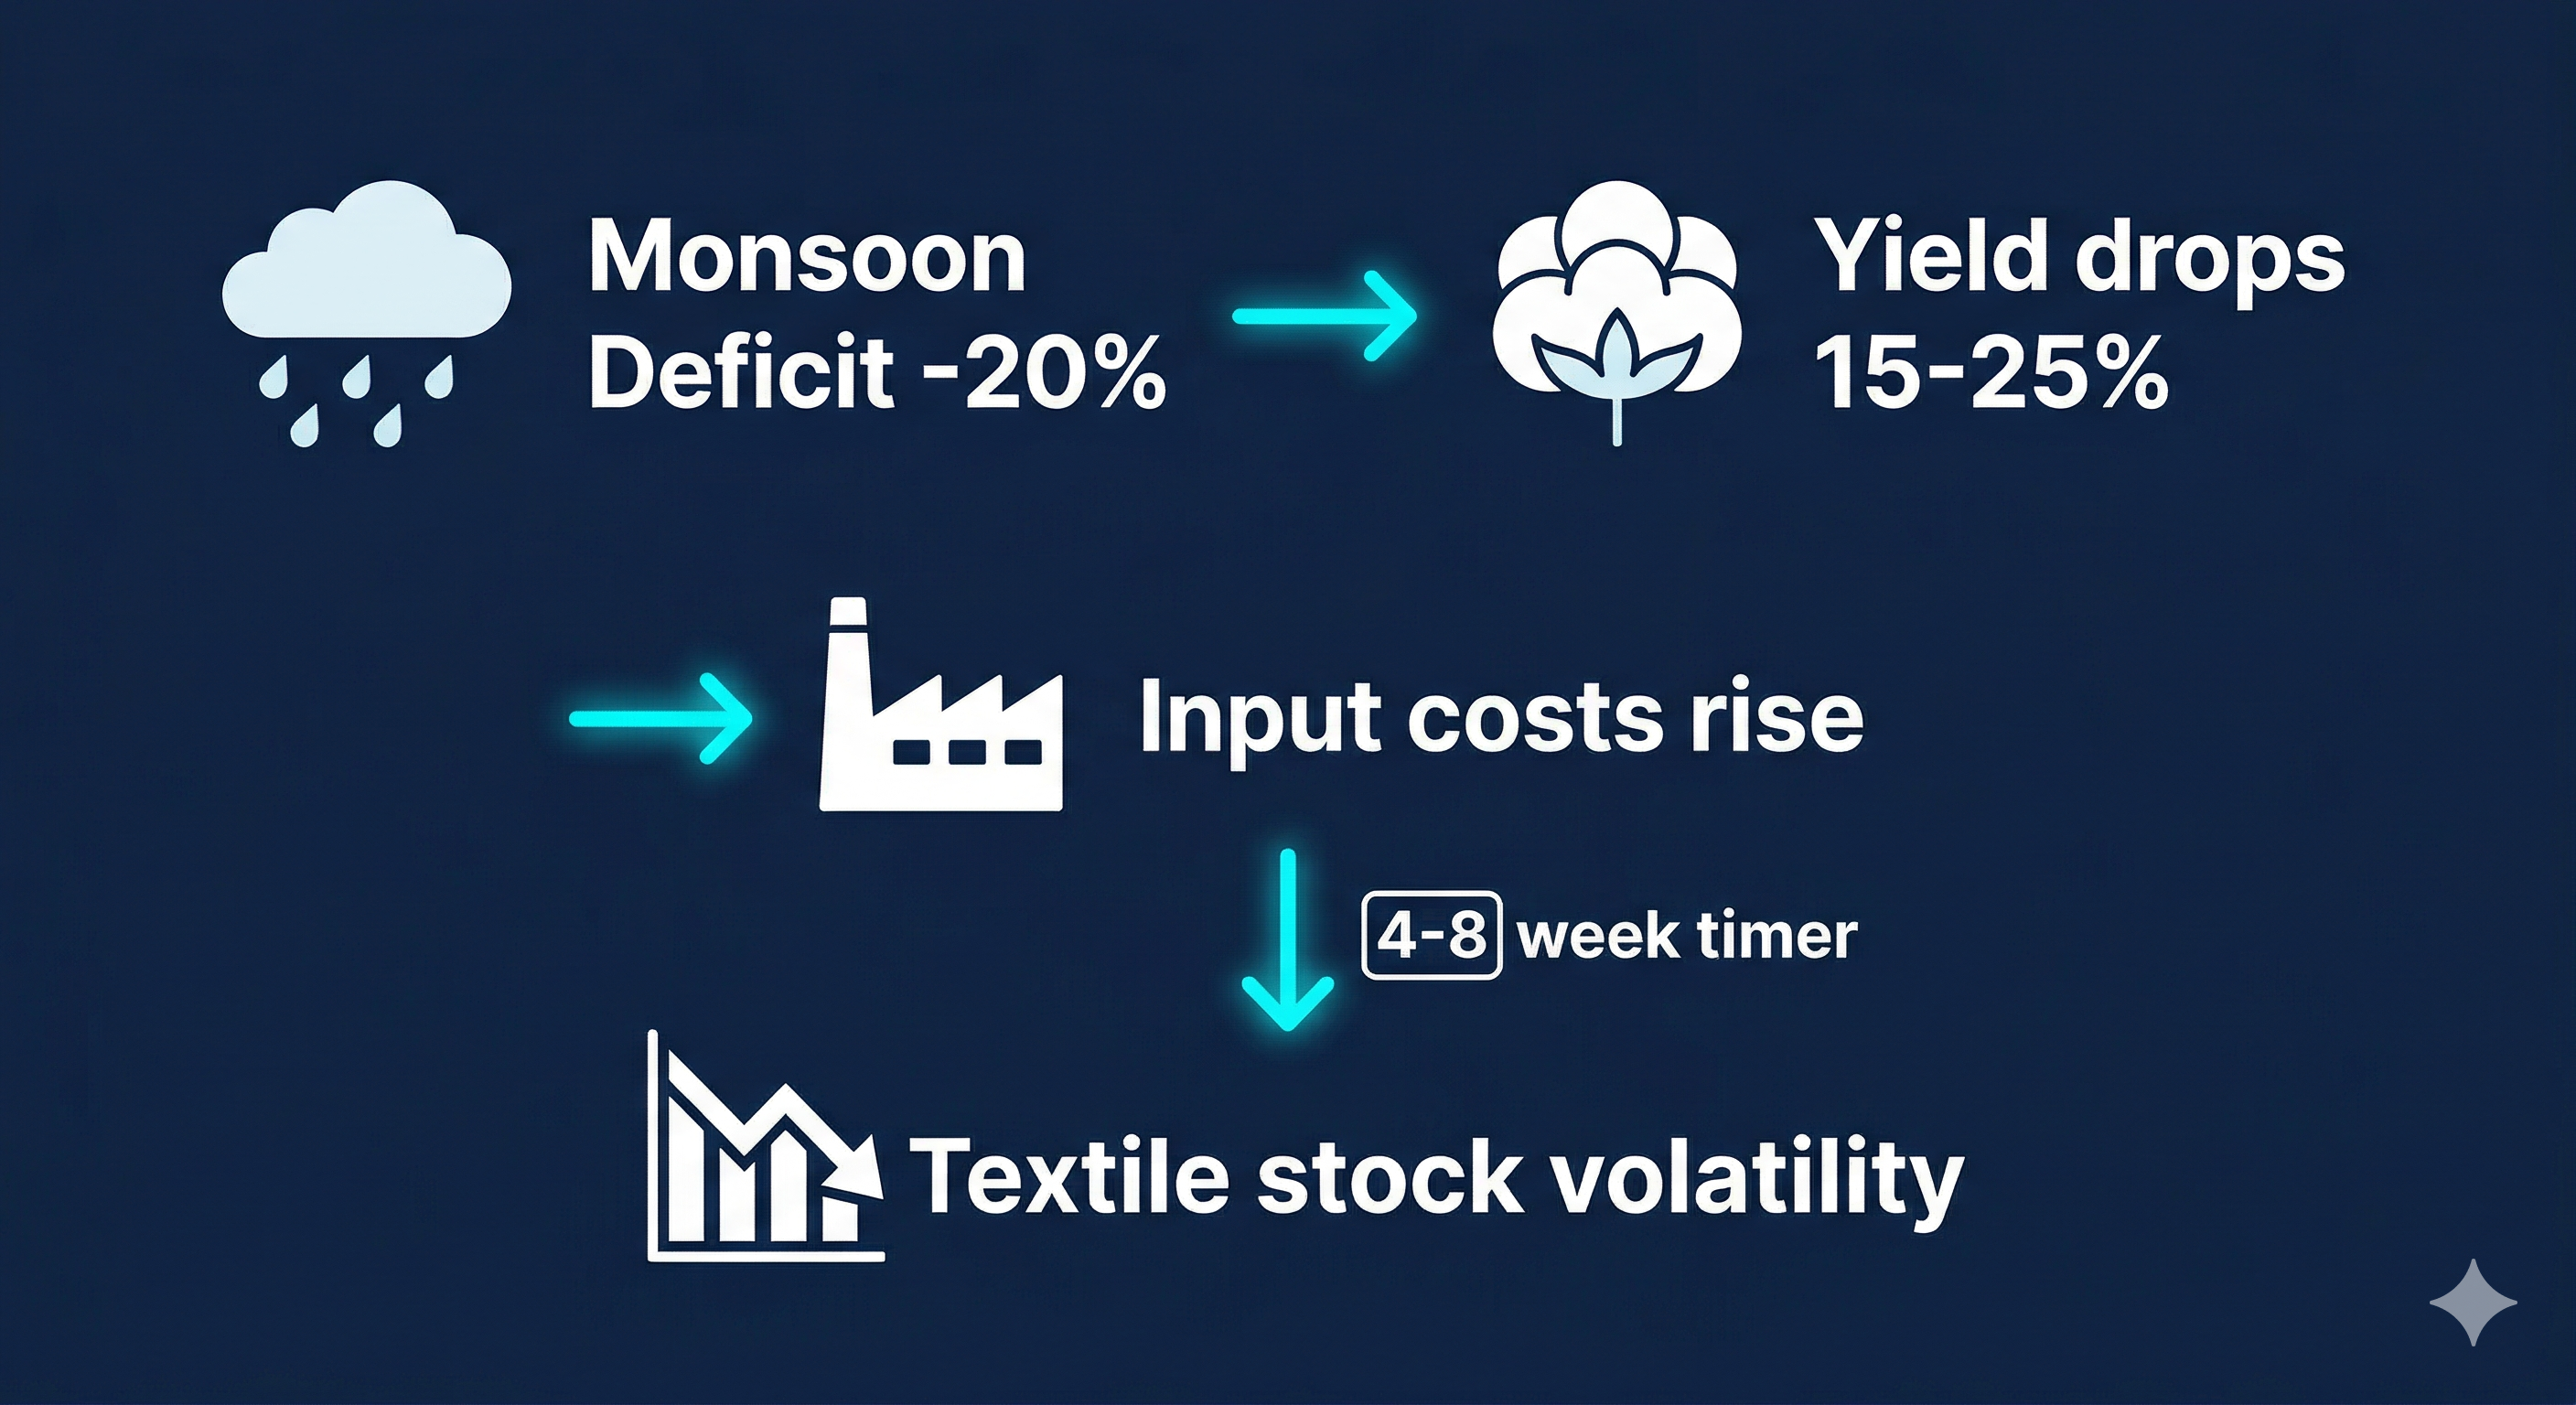
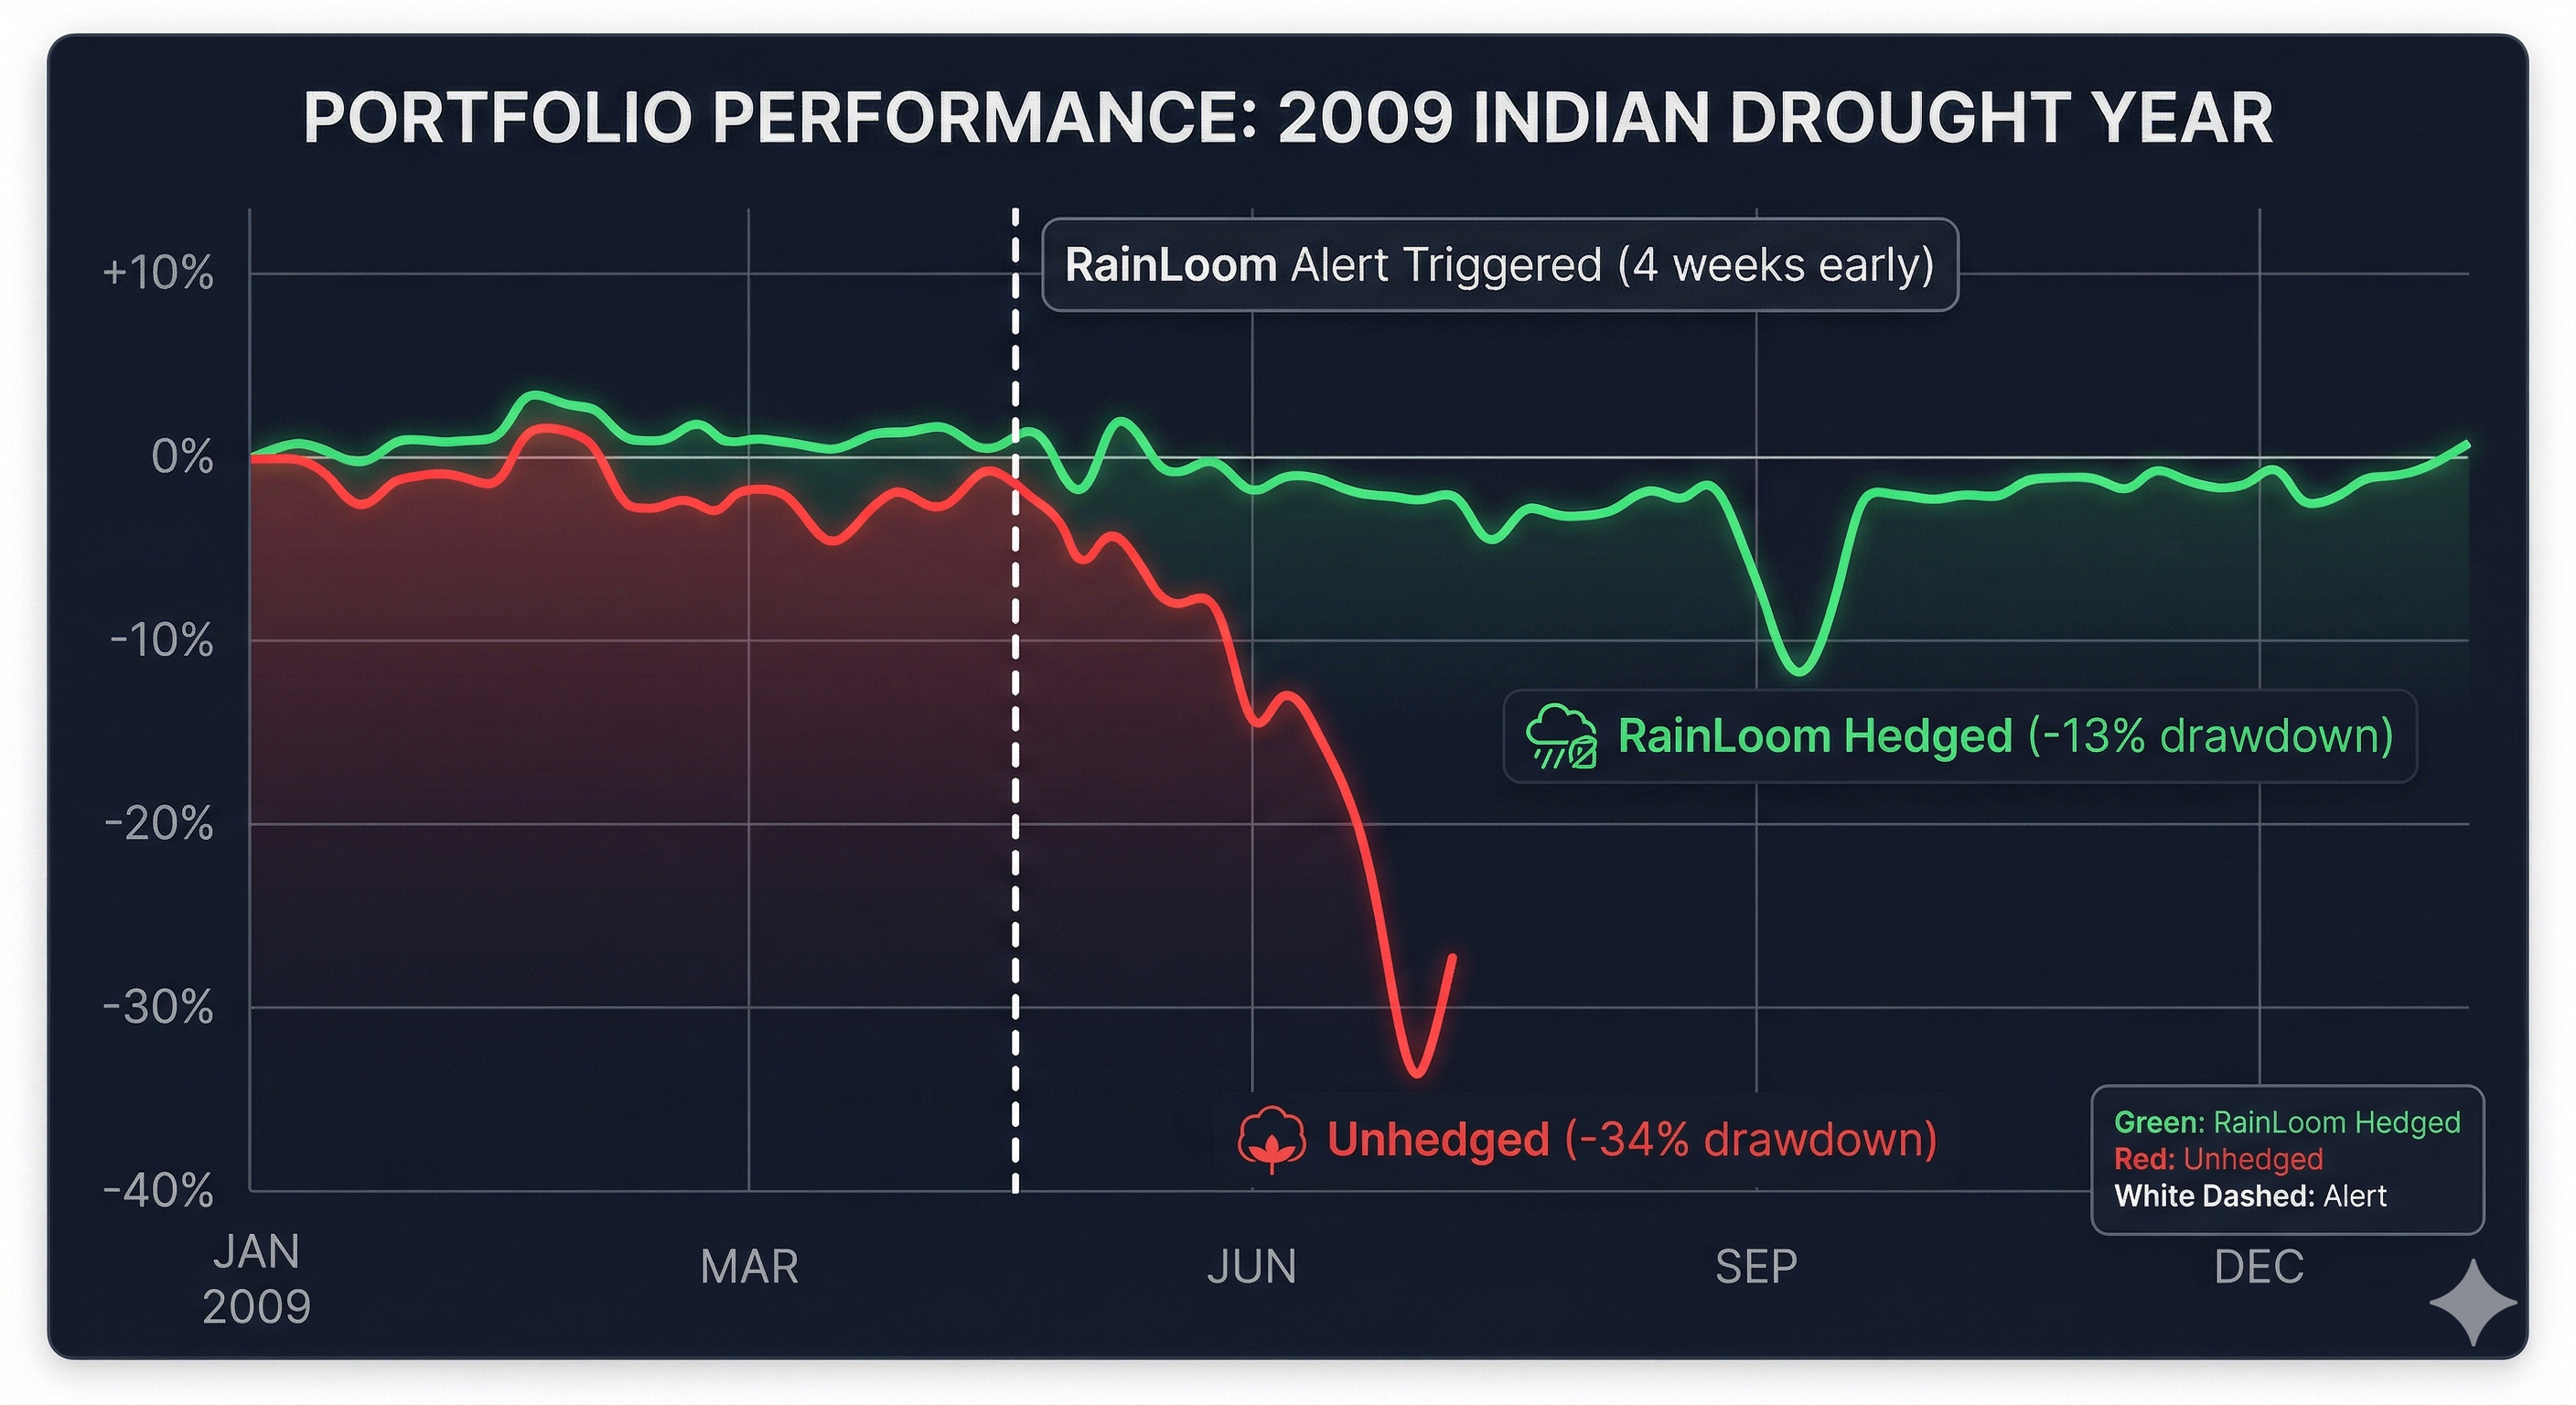
RainLoom connects monsoon failures to cotton prices to textile margin squeezes — giving portfolio managers a 4-week lead time on volatility spikes with AUC 0.81 accuracy, plus live alerts, geospatial nowcasts, and an institutional API layer.

0.81 AUC-ROC
8 NSE Stocks
83 Districts
4 wk Lead Time
5.8 F-Stat (IV)
18-24% Hedging Alpha
The Problem

Why is this hard?

India's Rs 12 lakh crore textile sector depends on monsoon-fed cotton. A single deficit season triggers a slow-motion crisis across the entire supply chain.

40-80%
Cotton in COGS — Extreme raw-material concentration leaves textile firms exposed to harvest failures.
4-8 wk
Signal propagation delay — Rainfall deficit in July hits earnings in January. Most analysts miss the connection.
Zero
Unified platforms — Climate, commodity, and equity data live in separate silos. Until now.
Monsoon deficit to textile stock volatility causal chain
Architecture

3-Layer ML Ensemble

Three models capture different aspects of the risk signal, then merge through stacked generalization.

Layer 1
GJR-GARCH Captures volatility clustering and leverage effects in textile stock returns.
Layer 2
XGBoost Classifier Gradient-boosted trees on 22 engineered features — monsoon deficit, cotton regime, VIX, ENSO phase.
Layer 3
LSTM Sequence Model Recurrent network captures temporal dependencies in the rainfall-to-volatility chain.
Python Streamlit XGBoost statsmodels SHAP Plotly yfinance
3-layer ML ensemble architecture: GARCH, XGBoost, LSTM
Dashboard

9 pages. One causal story.

Each page answers a specific question in the monsoon-to-volatility causal chain.

A global intelligence layer spans every page: AI chat, email and Telegram alerts, live tickers, and telemetry grounded in real dashboard data.

01 Real-time

Live Risk Monitor

Real-time ensemble risk scores for 8 NSE textile stocks with fan charts, live ticker strips, monsoon deficit meters, and cotton regime overlays.

02 Econometrics

Causal Analysis

Granger causality, VAR impulse-response, IV/2SLS, Sankey flows, and a knowledge graph that proves rainfall → cotton → volatility.

03 ML Ensemble

Model Performance

MS-GARCH, XGBoost, and sequence-model diagnostics with ROC curves, SHAP importance, and transparent temporal validation.

04 Interactive

Scenario Simulator

What-if tool for monsoon deficit, cotton prices, and VIX shocks that shows how risk propagates through the textile chain in real time.

05 Impact

Societal Impact

Actionable advisories for farmers and MSMEs, plus parametric payout simulation and a women's livelihood heatmap.

06 Backtesting

Hedging Backtest

MCX cotton hedge simulations across drought years with hedged vs unhedged P&L, drawdown, and Sharpe comparisons.

07 Geospatial

Geospatial Nowcast

Live rainfall maps across 83 cotton-growing districts with anomaly detection and NASA MODIS and NDVI raster overlays.

08 B2B / API

Institutional API Gateway

API key generation, webhook builders, and embeddable risk widgets for ERPs, internal dashboards, and supply-chain portals.

09 Demo Mode

Live Demo Playback

Walk forward through the 2009 drought week by week and watch the risk gauge spike before the market fully reacts.

Results

Validated on real
drought years

No toy datasets. Metrics are grounded in NSE equities, IMD rainfall, cotton signals, and live dashboard telemetry.

0.81 AUC-ROC
5.8 F-Stat (IV/2SLS)
18-24% Hedging Alpha
4 weeks Lead Time
Portfolio performance: 2009 Indian drought year - hedged vs unhedged

See it live

The full 9-page dashboard is deployed on Streamlit Cloud with live NSE, IMD, commodity, geospatial, and alerting workflows.